Best Metrics for Baseball Handicapping
Published on: April 20, 2025
Updated on: April 21, 2025
Category: Advice & Tips

The following post explores the best metrics for baseball handicapping.
When betting on baseball, it’s important to look past basic stats like wins and ERA. Using advanced metrics gives you a clearer picture of how teams really perform in all areas of the game.
Read: Baseball Handicapping Checklist
Related: How Much Do Umpires Matter in Baseball Handicapping?
Baseball has tons of metrics and it can be overwhelming. With so many numbers out there, the challenge is knowing where to focus and how to use the right metrics to make smarter picks.
Here’s what you need to know.
Hitting
A team’s offensive performance can make or break your bet, especially when it comes to totals and moneylines.
To get an edge, you need to understand not just how often they score, but how efficient and consistent their lineup is in different matchups and situations. Here are the key metrics to consider for hitting.
wRC+ (Weighted Runs Created Plus)
wRC+ adjusts a team’s offensive production for park factors and the league’s overall scoring environment, providing a clearer view of how well a team creates runs relative to the average.
A wRC+ of 100 is league average. A wRC+ of 120 means the team is 20% better than average. wRC+ helps you gauge a team’s overall offensive strength and how they might perform in different ballparks or against different pitching.
OPS+ (On-Base Plus Slugging Plus)
OPS+ is similar to wRC+ in that it adjusts for park and league effects, but it focuses specifically on a team’s ability to get on base and hit for power.
Like wRC+, an OPS+ of 100 is average, and anything above it indicates above-average offensive performance. OPS+ is a useful, quick snapshot to assess how well a team’s lineup is performing as a whole.
wOBA (Weighted On-Base Average)
wOBA gives a more comprehensive measure of a team’s offensive production than traditional on-base percentage (OBP) or slugging percentage (SLG).
It weighs different types of offensive events (like walks, singles, doubles, and home runs) based on their actual run-scoring value. A higher wOBA indicates a team is better at creating offense. wOBA is valuable for understanding how dangerous a team’s lineup is, especially when comparing them to league averages.
Splits vs. LHP/RHP
Teams typically perform differently against left-handed and right-handed pitchers.
By examining splits — how a team hits against lefties (LHP) vs. righties (RHP) — you can identify patterns that could influence betting decisions. For example, a team that struggles against left-handed pitching might be an easy target to fade when facing a strong southpaw pitcher.
BABIP (Batting Average on Balls in Play)
BABIP measures how often a team’s batted balls fall for hits.
A higher BABIP can indicate that a team is getting lucky, while a lower BABIP could suggest they’re underperforming. BABIP is particularly useful for spotting potential regression. If a team’s BABIP is unusually high or low, it can signal whether their offensive performance is sustainable or likely to change.

Pitching
Pitching is arguably the most important factor in baseball, but traditional stats like ERA don’t always tell the full story.
Advanced metrics give you a more accurate picture of a team’s pitching staff and can help you identify key factors that affect game outcomes. Here are the key metrics to consider for pitching.
FIP (Fielding Independent Pitching)
FIP focuses on the three outcomes a pitcher can control: strikeouts, walks, and home runs.
Unlike ERA, which can be influenced by a team’s defense, FIP isolates a pitcher’s performance and gives a clearer picture of their true ability. A low FIP means the pitcher is likely performing well and not getting unlucky with batted balls. It’s an essential stat for evaluating pitchers independently of external factors.
xFIP (Expected Fielding Independent Pitching)
xFIP takes FIP a step further by replacing a pitcher’s home run rate with the league-average home run-to-fly ball ratio.
If a pitcher has a high FIP but a low xFIP, they might be experiencing an unusually high or low number of home runs, and their performance is likely to regress toward the mean.
K/9 (Strikeouts Per 9 Innings)
K/9 measures how many strikeouts a pitcher gets per nine innings pitched.
K/9 is a good indicator of a pitcher’s ability to dominate hitters. Pitchers with high strikeout rates tend to limit scoring opportunities by avoiding balls in play that can lead to runs.
WHIP (Walks + Hits Per Inning Pitched)
WHIP is a simple metric that measures how many baserunners a pitcher allows per inning.
A low WHIP indicates that a pitcher is effective at preventing both walks and hits, limiting opportunities for runs to score. It’s a great way to gauge a pitcher’s ability to control the game.
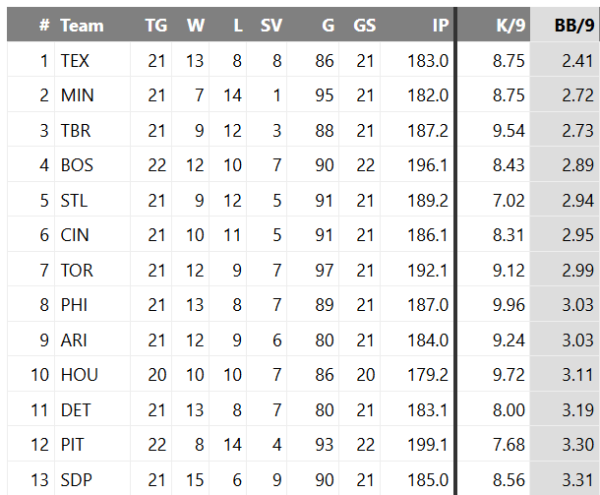
BB/9 (Walks Per 9 Innings)
BB/9 measures the number of walks a pitcher issues per nine innings.
High walk rates are never a good sign. Low BB/9 numbers are indicative of a pitcher who can work ahead in counts and limit free passes, making them more effective in controlling the game.


